Highlights
Selected results of the lab, newest first. Each highlight connects a research question with selected papers, code and data.
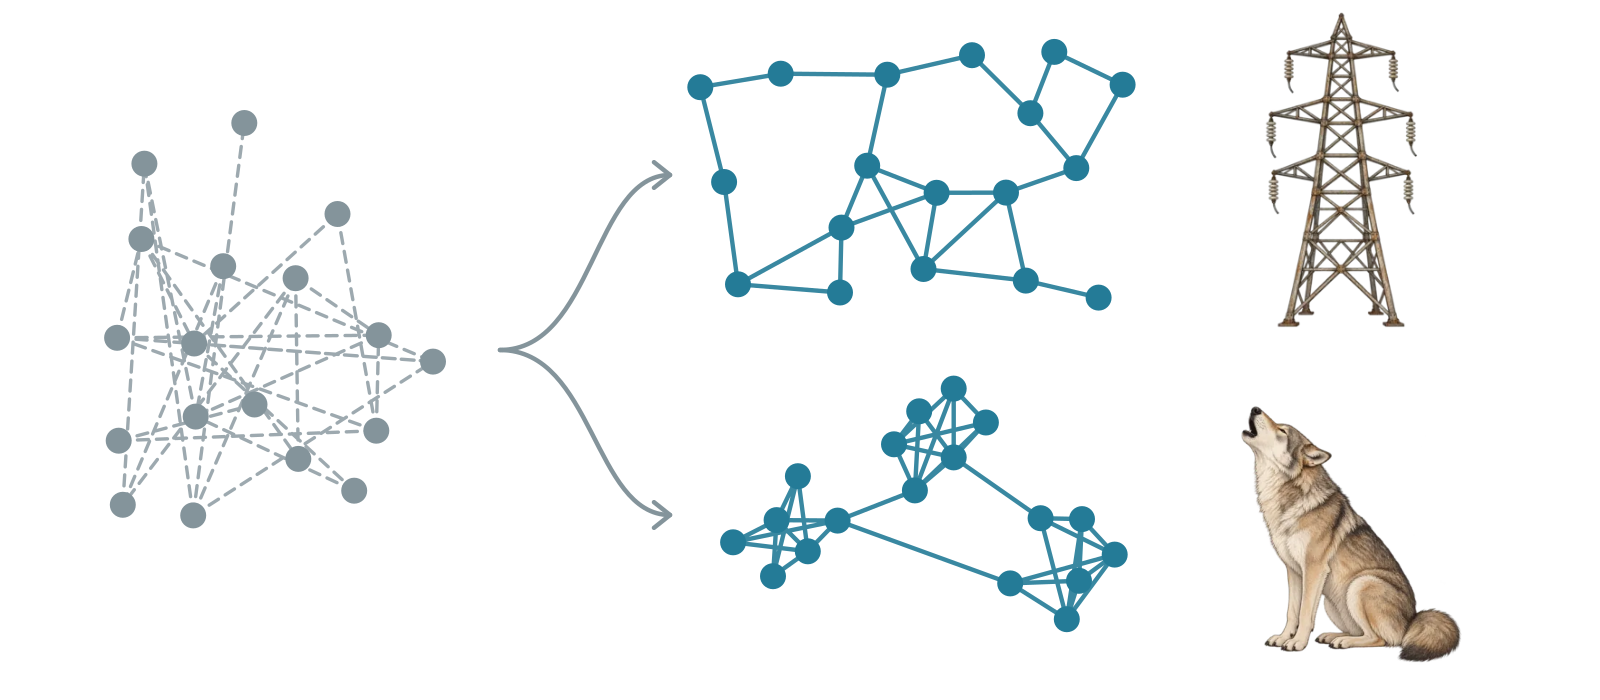
What a generated graph should preserve
How can generated graphs preserve the structures that distinguish real network domains, and how can generation be steered towards a target class?

From brain signals to meaningful networks
How can brain activity recordings reveal the interactions that distinguish subjects and characterise brain disorders?

Network Robustness and Resilience
Understanding network robustness
How much disruption can a complex network withstand, and how can the few units whose loss fragments it be found?
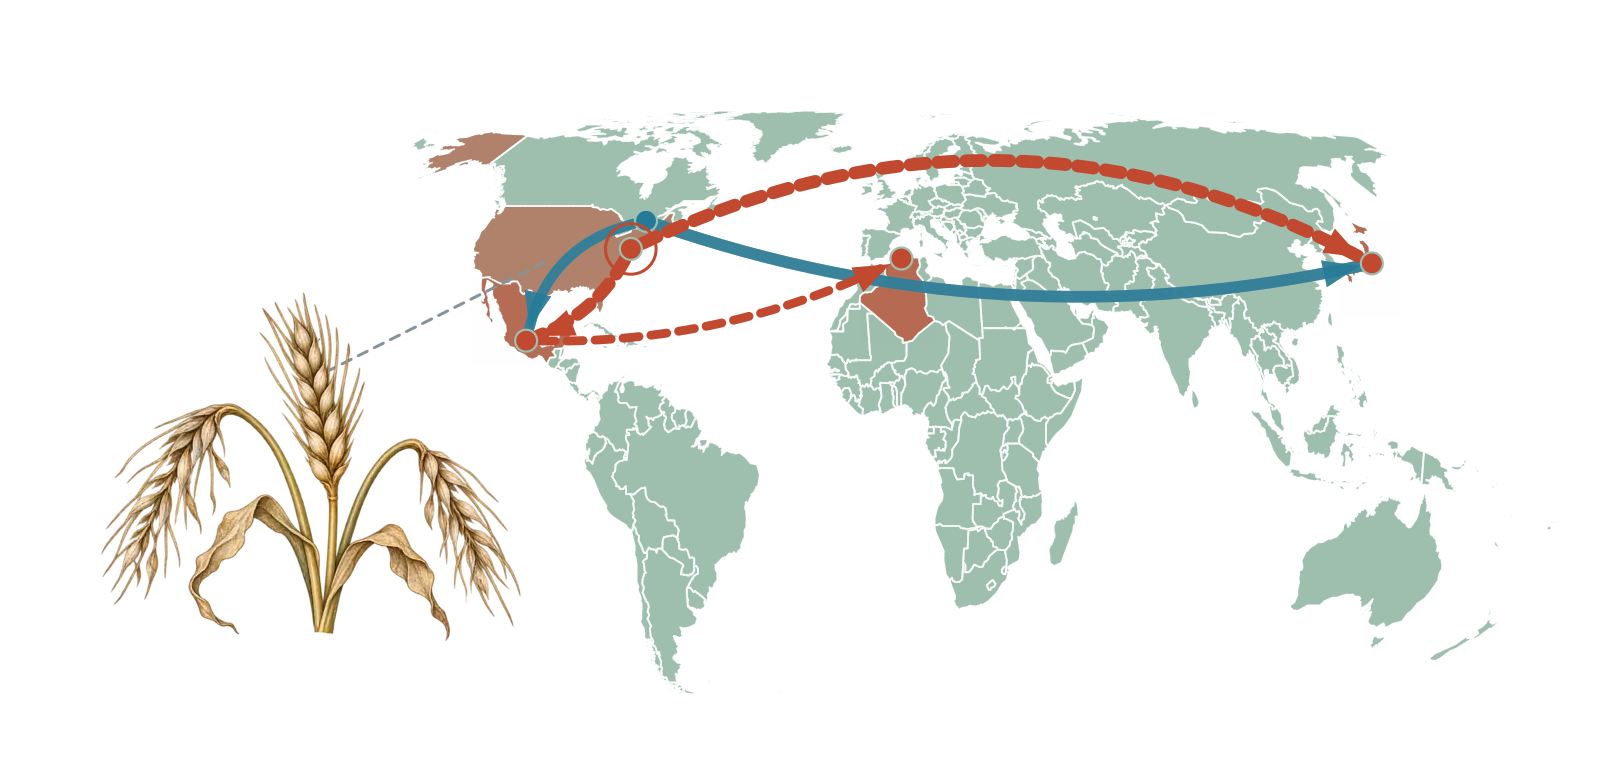
Multilayer Networks and Mesoscale Structure
The layered structure of global trade
How do commodity and industry layers organise international trade, and how do production shocks travel through it?